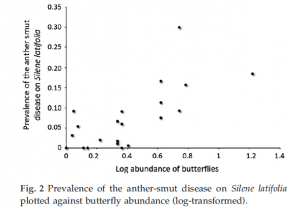
Graphs include labeled x- and y-axes, with corresponding axis titles. Axis titles include units of measure. The title for the graph is part of the legend and should NOT be displayed directly on the graph itself. Excel often automatically includes additional lines on the graph; these are removed from a final version. A legend is included if there is more than one series of data.
Example


You must be logged in to post a comment.