
Tables and figures are accompanied by a caption or legend. A legend allows the table/figure to stand alone without the need for the reader to refer back to the text.
The legend should include:
- Title: The first part of the legend acts as the title, indicating the relationship depicted in the graph. Clearly and succinctly describe what is shown in the table/figure.
- Note: Avoid using a title of X vs. Y—be more descriptive.
- Methods: Very brief. Organism studied (including scientific name), context for the experiment (treatment applied, etc.), location (if a field study), culture conditions (if appropriate), sample size (n=#), when conducted (if field study).
- Results: Summary statistics plotted if it is a figure (e.g. if you display the mean+/- SE, indicate that these are the statistics you are using, as opposed to another central tendency like median or another assessment of variation like SD). Do not include the values.
- Descriptions: Any points of clarity that need to be made in order to interpret the figure.
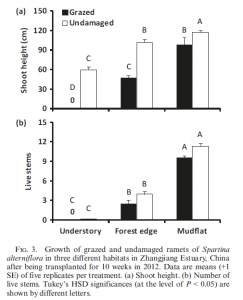
Example
Additional examples of legends may be found in the figures, pictures, and tables links.
Additional information on tables and figures.
You must be logged in to post a comment.